The Test Method
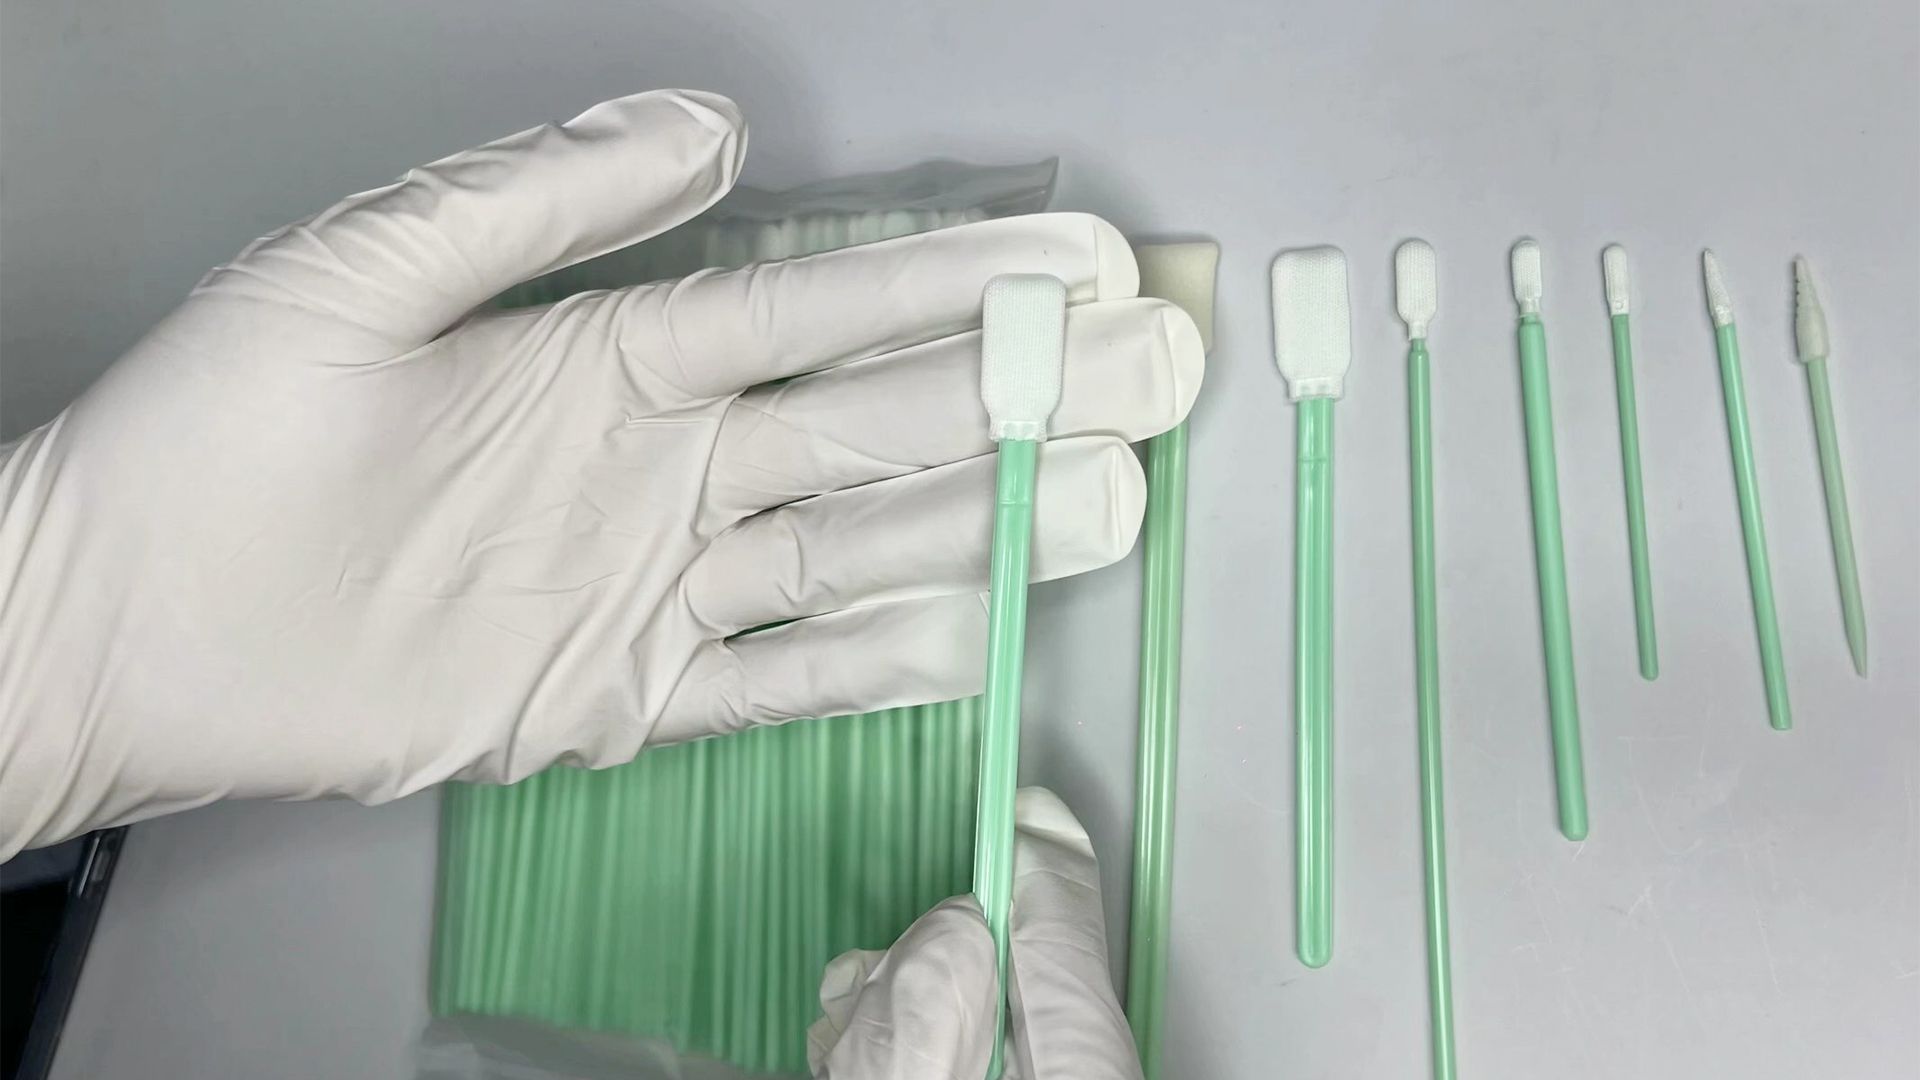
We tested three swab types from three different suppliers. All swabs were labeled as cleanroom grade. The test method followed IEST‑RP‑CC004.3 for liquid particle counting. Each swab was extracted in DI water and the extracted particles were counted using a laser particle counter.
| Swab type | Head material | Bonding method | Claimed cleanroom class |
|---|---|---|---|
| Swab A | Polyester knit | Thermal bond | ISO 5 |
| Swab B | Polyurethane foam | Heat seal | ISO 5 |
| Swab C | Microfiber (80/20) | Ultrasonic weld | ISO 4 |
The Test Results Particle Shedding
The results showed dramatic differences.
| Swab type | Particles per swab (≥0.5μm) | Particles per swab (≥5μm) |
|---|---|---|
| Polyester knit (Swab A) | 320 | 28 |
| Polyurethane foam (Swab B) | 1850 | 95 |
| Microfiber (Swab C) | 95 | 8 |
The foam swab shed nearly 20 times more particles than the microfiber swab at the 0.5 micron size. The polyester swab was in the middle.
Why Foam swabs are made from open‑cell polyurethane. The foam structure traps particles during manufacturing. Even after cleaning some particles remain embedded and release during use. Microfiber swabs use continuous filament yarns with thermal or ultrasonic bonding which minimizes loose fibers.
Why Particle Data Matters More Than Packaging
Many suppliers claim their swabs are cleanroom grade. But cleanroom grade can mean different things. ISO 5 cleanroom packaging does not guarantee low particle shedding. Some swabs are packaged in ISO 5 but the swab itself sheds thousands of particles.
We tested a swab that came in a cleanroom bag with a label that said Class 100. The particle shedding was 2100 particles per swab at 0.5 micron. The packaging was clean but the swab was not.
Always ask for the particle test data. A good supplier will provide IEST‑RP‑CC004.3 test results for each batch.
Other Important Parameters
Particle shedding is not the only thing that matters. Depending on your application you should also check.
NVR (non‑volatile residue)
For optical or semiconductor applications NVR should be below 0.1 mg per swab. We tested the three swabs.
| Swab type | NVR (mg/swab) | Ionic residues (Na⁺, Cl⁻ μg/swab) |
|---|---|---|
| Polyester knit | 0.08 | 0.3 |
| Foam | 0.25 | 0.8 |
| Microfiber | 0.04 | 0.2 |
The foam swab had significantly higher NVR and ionic residues due to residual surfactants from the foam manufacturing process.
Absorbency
For solvent application absorbency matters. We tested how much IPA each swab can hold.
| Swab type | IPA absorbency (ml/swab) |
|---|---|
| Polyester knit | 0.4 |
| Foam | 0.7 |
| Microfiber | 0.9 |
Foam and microfiber hold more liquid but may release particles. Choose based on your priority.
Which Swab Should You Choose
| Application | Recommended swab | Why |
|---|---|---|
| Fiber optic connector cleaning | Microfiber or polyester knit | Lowest particle shedding |
| PCB flux removal | Polyester knit | Good solvent resistance moderate particles |
| General cleanroom wiping | Polyester knit | Balanced performance and cost |
| Applying lubricants or coatings | Foam | High absorbency but higher particles |
| Semiconductor wafer handling | Microfiber | Ultra low particle and low NVR |
How to Test Swabs Incoming Without a Lab
If you do not have a particle counter you can do a simple visual test.
Take a clean black glass plate or a mirror. Dip the swab in IPA and wipe the plate firmly 10 times in the same spot. Shine a bright light at an angle. If you see white specks or fibers the swab is shedding particles.
Compare different swabs side by side. The swab that leaves fewer visible particles is better.
This test is not quantitative but it catches very poor quality swabs.
A Real Case
A fiber optic component manufacturer had recurring signal loss after connector end‑face cleaning. They used foam swabs with IPA. The failure rate was 2.8 percent.
We tested their swabs. Particle shedding was 2100 particles per swab at 0.5 micron. The foam was shedding fibers onto the ferrule end face.
They switched to a microfiber swab with ultrasonic bonding. Particle shedding dropped to 95 particles per swab. The failure rate fell to 0.3 percent. The new swab cost slightly more per piece but the reduction in rework saved them over 15000 dollars per year.